
Dealer Websites: When Gaming Google Hurts

It’s been nearly 6 years since “Dieselgate” broke and Volkswagen was busted by the EPA for gaming their diesel car emissions tests. When the vehicle emissions were tested, the vehicle software adjusted the emissions to be “clean”, when in reality they were anything but. The result of this scandal ranged from lawsuits to government fines. The lesson, aside from the various ethics debates we could have over beer, was that gaming the EPA might have seemed like a good idea at the time, but when they got caught it cost Volkswagen its reputation and a carload of money.
“Gaming” Google”
But what if I told you that I can show you that at least 3 website vendors are gaming Google in a similar fashion. Is this a victimless act or does it potentially cause problems for dealers?
What’s the game? It’s simple: Some vendors serve up an amended version of their website when Google’s tools evaluate the website’s performance. While you’re seeing a fully functioning website, Google “sees” a bare-bones fraction of the real thing. The result is that Google thinks that the site is extremely fast, when the truth is something else.
How’d We Get Here?
I imagine that you are now wondering how we discovered the “game”. It’s pretty straightforward. Part of the work that we have been doing for the last 21 years is creating performance optimized websites for dealers. This means that we have a lot of experience building websites that work as well as possible for dealers given the constraints sometimes imposed by OEMs, and the myriad of third party apps and code embedded on websites. As our work evolved, we started using Google’s algorithm as a benchmark for success through its Google Lighthouse Chrome extension and its Google PageSpeed Insights tool (they both basically do the same thing, but GPSI is easier to use).
How did we do this? A couple of years ago we built a tool called SurgeRecon that, among other things, evaluates website performance for a range of factors. For the purposes of our conversation here, the analysis gives us information on mobile page speed and SEO, two things that are critical to website success for a dealer. This data, drawn from Google Lighthouse or GPSI, can identify the probable causes of a slow website thus giving you a checklist for potential success.
Time to Test and Validate
We decided to test Google’s recommendations over a year ago on a bunch of our dealer websites and the data was compelling.
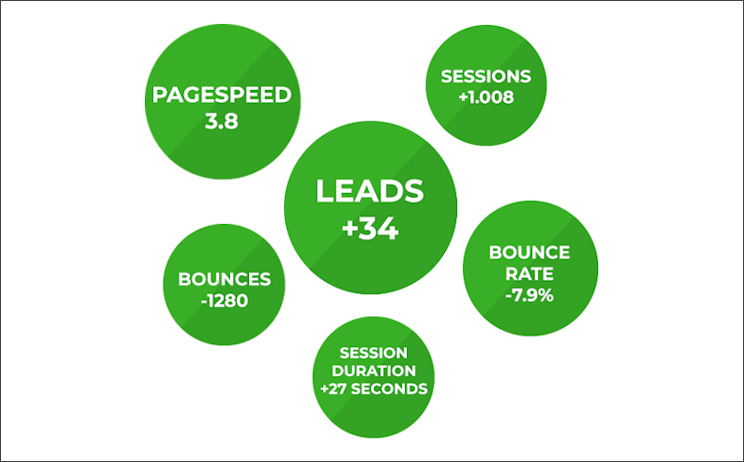
When we compared the performance of these Google optimized websites to their unfixed earlier versions of a year before, we discovered significant improvements:
- Page speeds had been cut in half to about 3.8 seconds
- Sessions had increased and their average duration had improved by 27 seconds
- Bounces had significantly decreased
- And, most importantly, organic leads had increased by an average of over 30/month
This data tells us that Google’s recommendations work. Therefore, ignoring Google’s evaluation, or gaming it so that one’s mobile speed appears better than it really is, risks lost opportunities for the dealer. (Follow this link to read our full post about our work on this subject written by me with David Kain and Tom Kline, both industry heavyweights.)
What Your Customer Sees vs What Google Sees
Let’s now take a look at what “gaming” looks like. We’ll start with a simple Google Lighthouse analysis of a buy here/pay here dealer (seen below).
Check out those stats!!! This dealer’s mobile website is rated 100/100 (#1) for performance. That’s incredible, but it is just too good to be true.
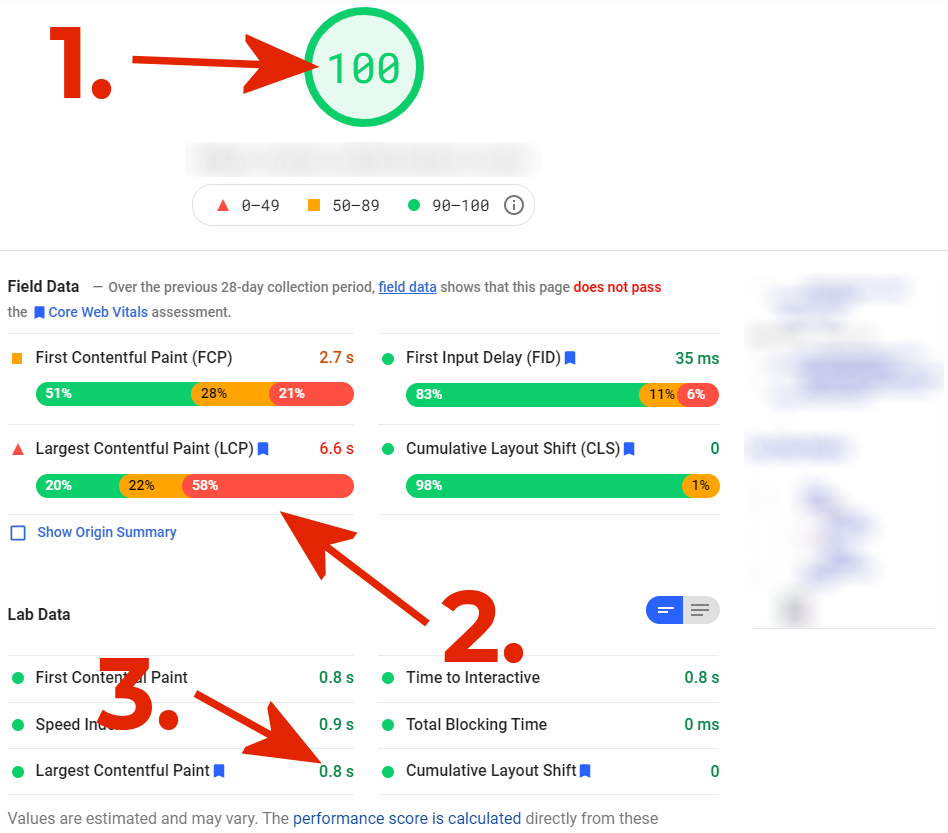
If you look at #2 below, you see that the “largest contentful paint” (when the site is ready for interaction) is 6.6 seconds. Not good. But when you look at #3, you see that the reported time is only .8 seconds. Oops.
Those are the reported numbers. What you might ask now is what do the actual “websites” look like?
For the dealer website that we’re showing here, here is a comparison between “What you see” and “What Google sees” when the website gets tested by Google.
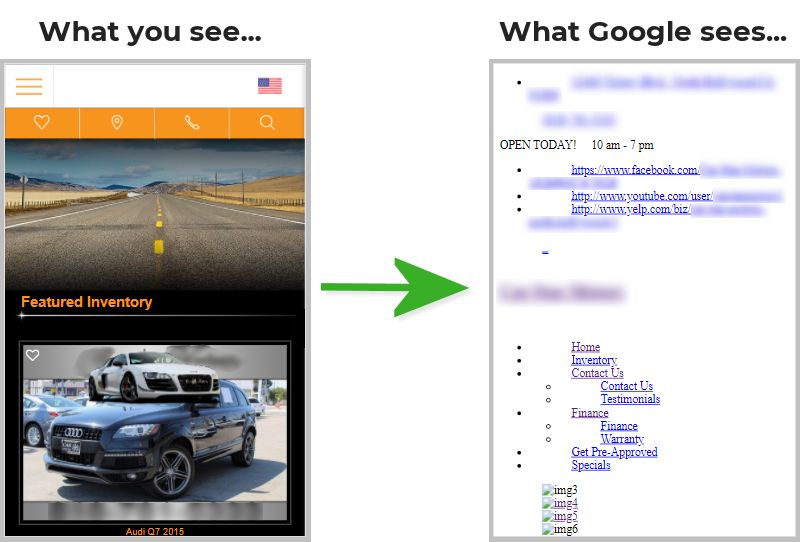
This difference is massive. The gamed version on the right lacks images and third party apps and code that can slow down load time. In order to serve up the abbreviated site on the right, the website code does something called “user agent sniffing”. In this case, it identified that Google Lighthouse was testing the site, and then served up a different batch of code. It might be a mistake or intentional. You decide. But remember: The most important lesson here is that the mobile website does not take .8 of a second to load before it is usable; it actually takes over 6 seconds. This is important because according to a Forrester study (from over 10 years ago), 40% of consumers won’t wait more than 3 seconds for a web page to load before abandoning the site. Add on more seconds, and even more people abandon the site. Get to 10 seconds, and many won’t ever return.
So What Can You Do?
Test with Google PageSpeed Insights
Testing with Google is very easy. All you have to do is follow this link, enter your dealer website’s URL, and select the “ANALYZE” button.
Don’t be surprised if the results are poor, say 30/100 or lower for your mobile page speed (how long your mobile website takes to download to a mobile device). That’s very common, and even high when you look at the industry average of 13/100 (from a test we did with over 10,000 dealer websites).
However, if your results seem really good, say 80 or higher, then getting a second opinion is advised. To do this, you can download another extension called User Agent Switcher for Chrome and add it to Chrome.
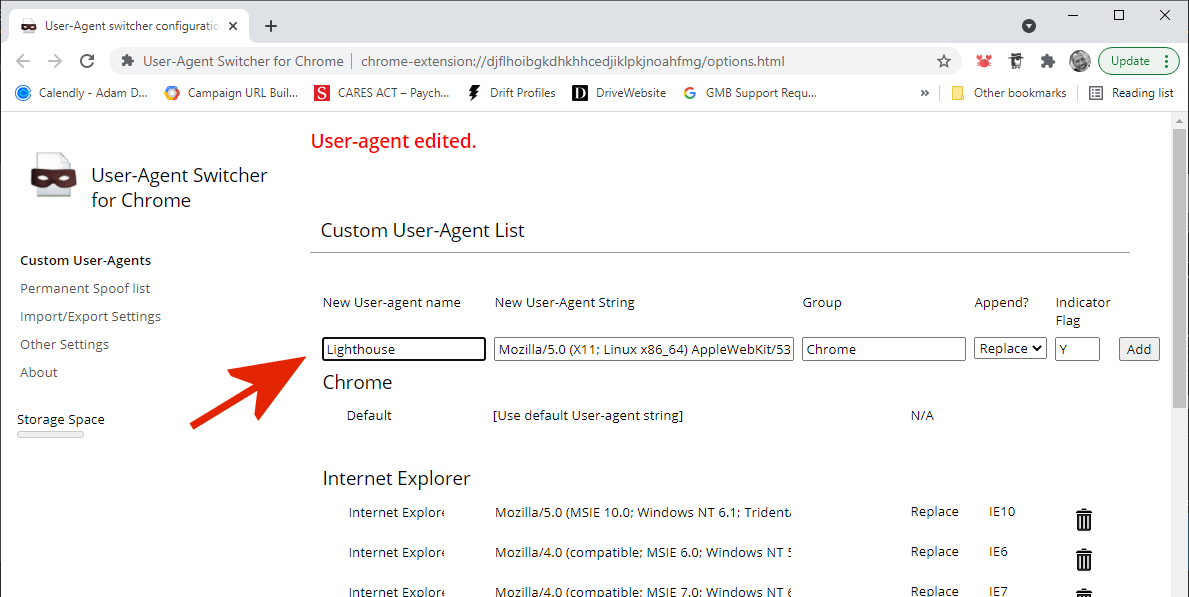
Once loaded, find the extension, click your right mouse button on the extension, select Options, and then add this information to the User-Agent list: Mozilla/5.0 (X11; Linux x86_64) AppleWebKit/537.36(KHTML, like Gecko) Chrome/61.0.3116.0 Safari/537.36 Chrome-Lighthouse. Once done, save the item, open the extension, and then load your website.
Of course, if you want to skip the work to set up User Agent Switcher, then just use our free SurgeDective app. It just takes a few seconds to test.
Hopefully, when you run your test, the website will look like your existing site. If it doesn’t, has less content, or is just a bunch of text, then you have a problem. You should talk with your vendor to see what’s going on or contact us for help.
Where Do We Go From Here?
Testing your website every quarter is a good idea. Websites can collect code and other things that slow down its performance over time. Getting the test done lets you know how well your site is working, or if it has problems, it tells you that you better get your vendor on the line to do some improvements.
To encourage improvements, you can request that your vendor run the GPSI test, and then discuss the results with you. Or, if you find out that your vendor appears to be gaming Google, then you can have them use our SurgeDective tool, and Google PageSpeed Insights, to make improvements.
Whatever you do, paying attention to your site speed is critical. Every second above 3 seconds can cost you a customer. And that means potentially lost money for you.


Adam Dennis
DMM Expert
With over two decades of experience revolutionizing the automotive industry, Adam leads SurgeMetrix who, through Bilingual Marketing Strategies, AI powered SEO, Market Intelligence Analytics, & Cybersecurity solutions, help dealerships build new markets.
Focused on data - finding it, understanding it, leveraging it and protecting it - Adam is invested in providing solutions which help dealers make informed decisions about how best to sell cars.
Get Curated Insights
Content worth the click
Related Articles


